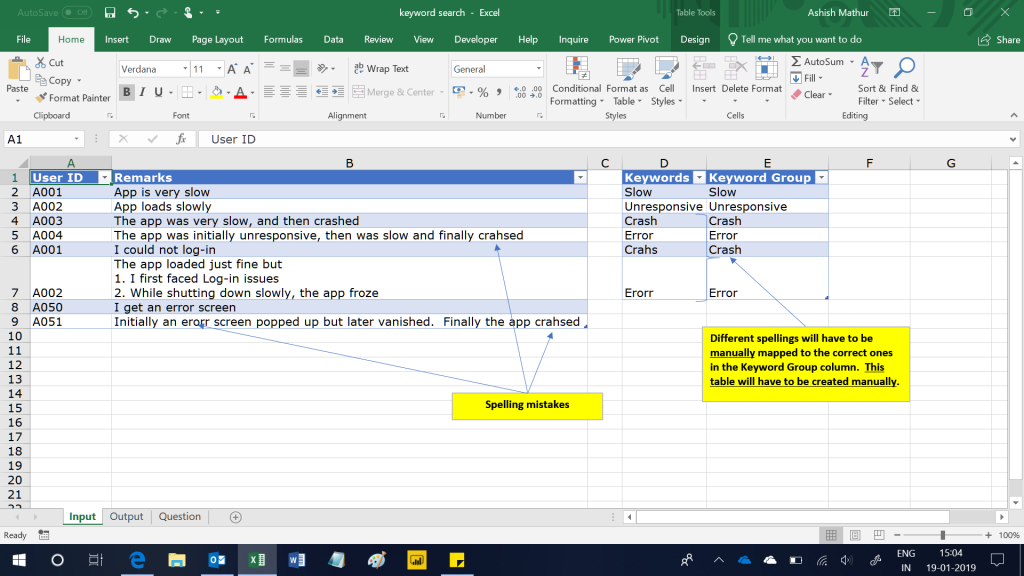
Here is a 2 column dataset – UserID in column A and Remarks in Column B. This dataset basically tabulates the remarks/comments shared by different users. Entries in the Remarks column are basically free flowing text entries which have the following inconsistencies/nuances:
- Users reported multiple errors which are separated by comma, Alt+Enter (same line within the cell) and numbered bullets
- Users committed spelling mistakes (see arrows in Table1)
- A user ID may be repeated in column A
Given this dataset, one may want to “hunt” for specific “keyword Groups” (column E above) in each user remark cell and get meaningful insights. Some questions which one would like to have answers to are:
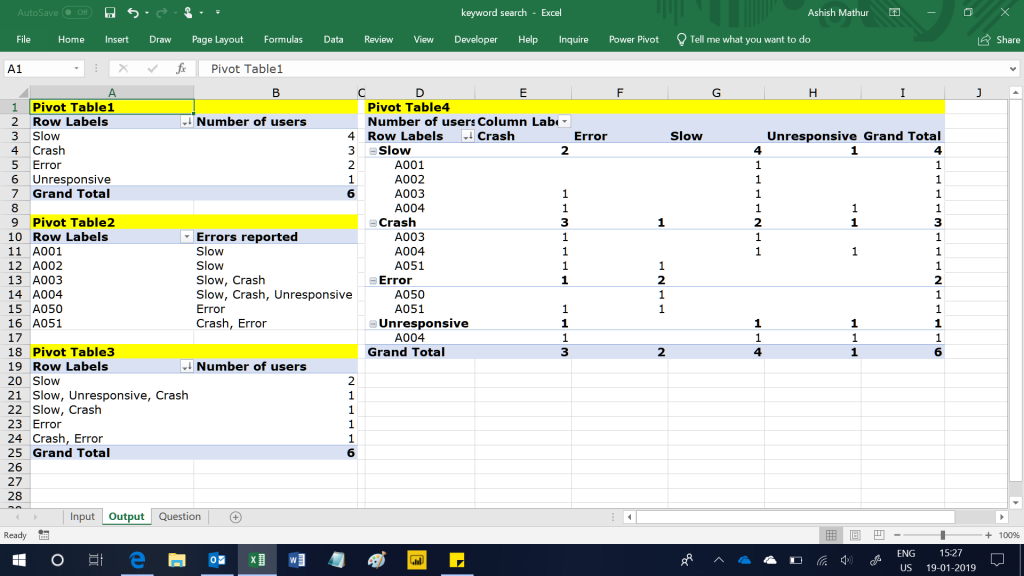
- How may users reported each type of keyword Group – “How may users used the Unresponsive keyword?”. See Pivot Table1 below.
- Which are the keyword Groups that each user reported – “Which are the different keyword groups reported by UserID A004?”. See Pivot Table2 below.
- How many users reported each of the different keyword Groups – “How many users reported all 3 problems of Slow, unresponsiveness and crash”. See Pivot Table 3 below.
- How may users who used this keyword group also used this keyword group – “How many users who reported Crash also reported Unresponsive?”. See Pivot Table 4 below.
This was quite a formidable challenge to solve because of spelling mistakes and multiple keywords reported in each cell. I have solved this problem with the help of Power Query and PowerPivot. You may download my workbook from here.


Analyse free flowing text data or user entered remarks from multiple perspectives
{ 0 Comments }