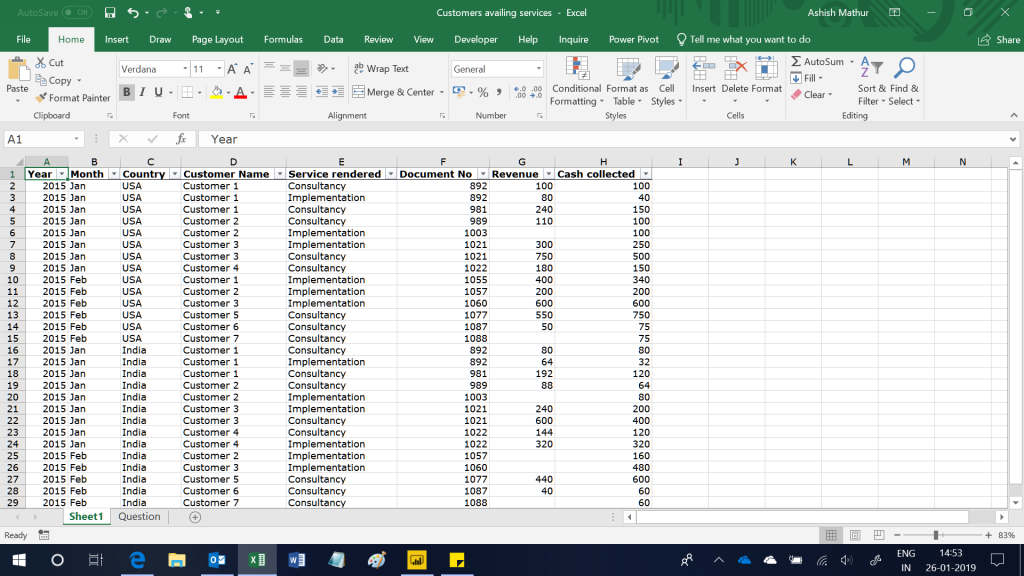
Here is a Sales dataset of 8 columns and 29 rows. It basically details the revenue earned and cash collected by service type, Customer, Country and Period. For a selected Country and time period, there could be customers availing of both services or of any 1 service.

There are 2 broad questions that one may want to get answers to:
- Determine the number of customers who availed of a certain number of services
- Determine customers with whom business was forged for the first time and those who churned out
For a chosen country and Year/Month, the first question stated above further sub-divides into:
- How may customers availed of both services – Consultancy and Implementation
- How may customers availed of only one of the two services
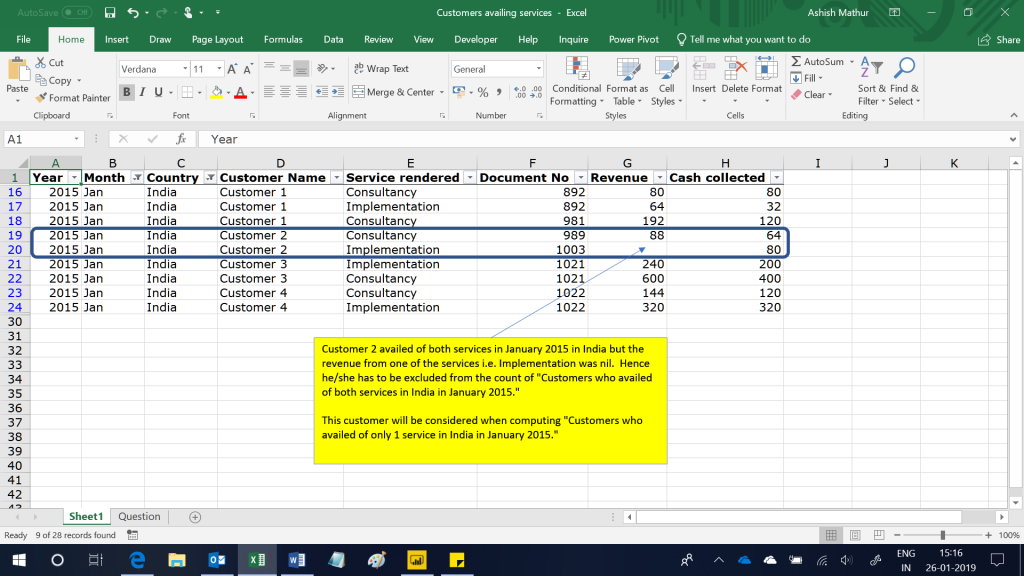
So if a user selects the Country as India and Year/Month as January 2015, then Customers who availed of both services would be 1,3 and 4. Note that Customer 2 should not be considered (even though he/she availed of both services) because the revenue earned from one of the services (Implementation) was nil. For the same selection (India and January 2015), the Customers who availed of only 1 service would be Customer 2 – this customer availed of only the Consultancy service (Revenue was earned from this Customer only for this service). After applying a filter on the source dataset, the rows for India and January 2015 are:
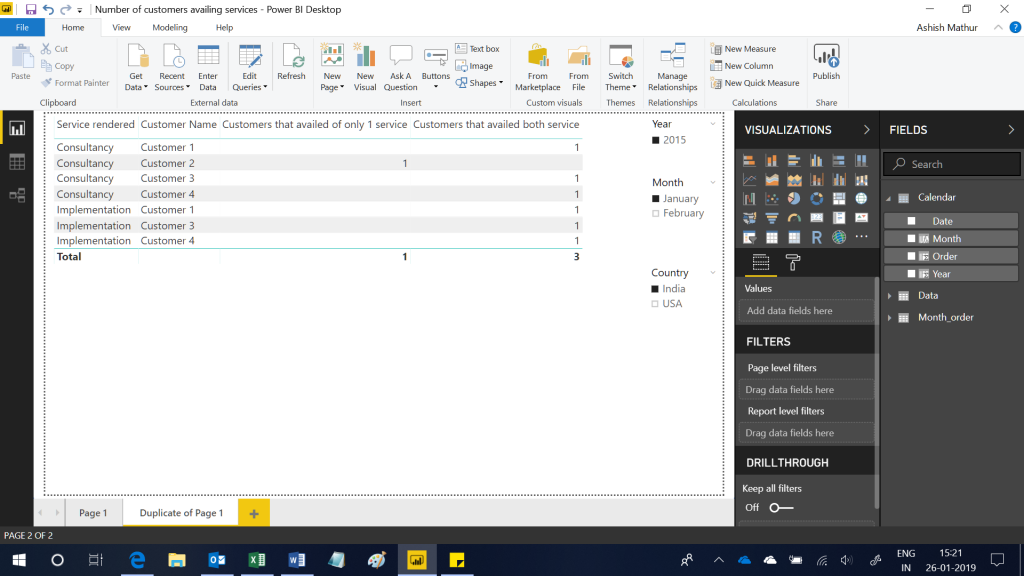
The expected result is shown below in PowerBI desktop software. If you are not concerned with who those customers are (you just want the count), then you may simply remove the Customer Name field from the visual.
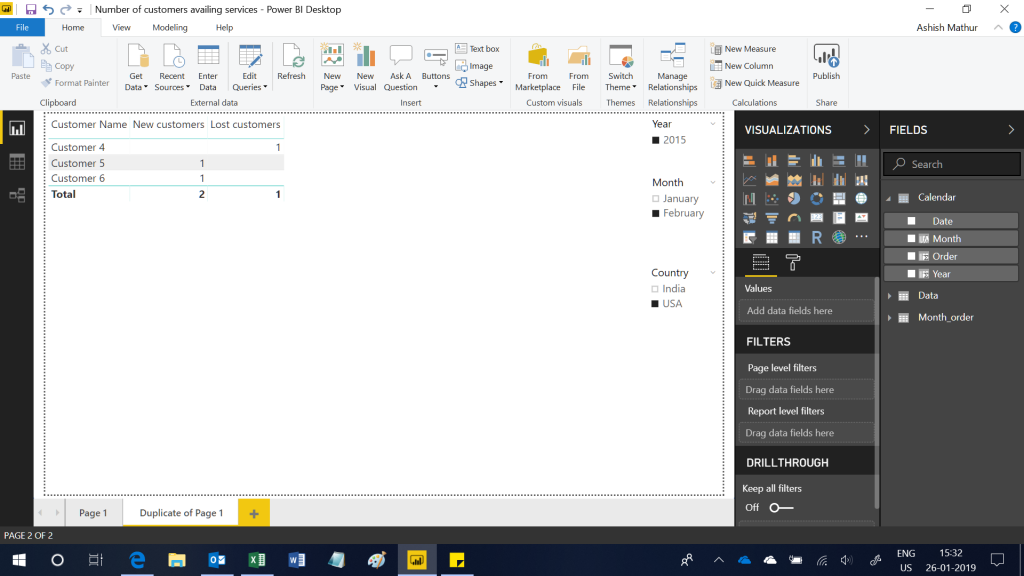
The second question is to determine the number of new and lost customers. If a customer was not in the database in any prior month, the customer is identified as new. To clarify, a customer who availed of the Consultancy service in a prior month also availed of the Implementation service for the first time in the current month would not be counted as a new customer. If a customer ceases to generate revenue in any month, the customer would be counted as lost (churned) in that month. So when USA is selected in the Country slicer and Year/Month is February 2015, the expected result is:
I have solved this question with the help of the PowerPivot. You may download my PowerBI desktop solution file from here and source Excel workbook from here. This problem can also be solved in MS Excel using the PowerPivot.


2 Trackbacks