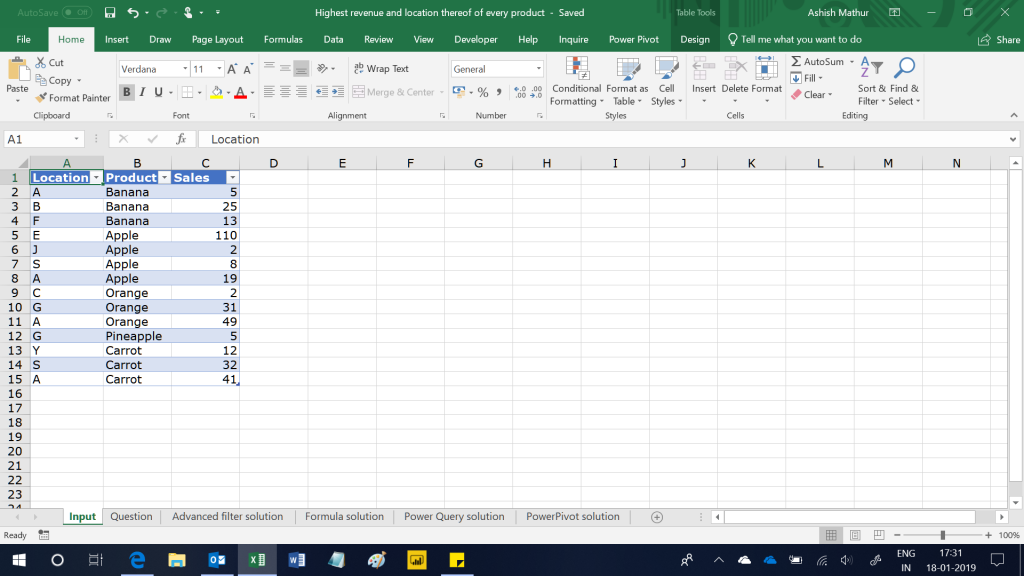
Visualise a 3 column dataset as shown below – Location, Product and Sales. Each location can have multiple products (Product A has Banana, Apple and Carrot) and each product can be sold in multiple locations (Banana is sold in locations A, B and F).
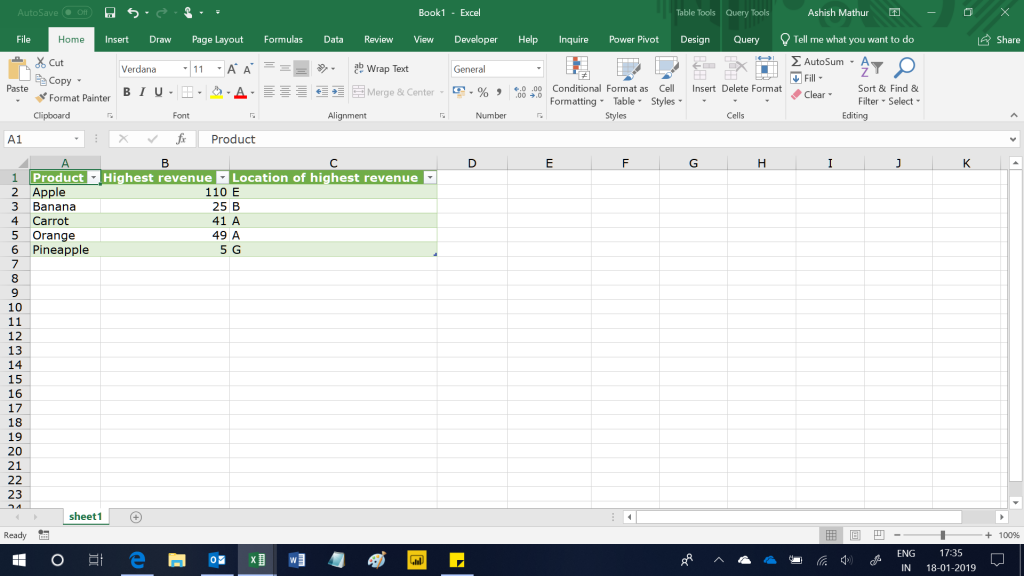
The objective is to determine the location with highest sales for each product. So for Banana, maximum sale value is 25 and location of maximum sales value is B. Likewise for Orange, maximum sales value is 49 and location of maximum sales value is A. The expected result is:
I have 4 solutions to this problem:
- Advanced Filters – This is a static solution. For any changes in the source data range, one will have to re-enter the 3 inputs in the Advanced Filter window
- Formulas – This is a semi-dynamic solution. To make it fully dynamic, one will have to write an array formula to first extract all unique product names in a column. The array formula to extract product names in a column can be obtained from here.
- Power Query – This is a dynamic solution. For any changes in the source data sheet, one just has to go to Data > Refresh All
- PowerPivot – This is a dynamic solution. For any changes in the source data sheet, one just has to go to Data > Refresh All
You may download my solution workbook from here.


Determine the top selling location for each product
{ 0 Comments }