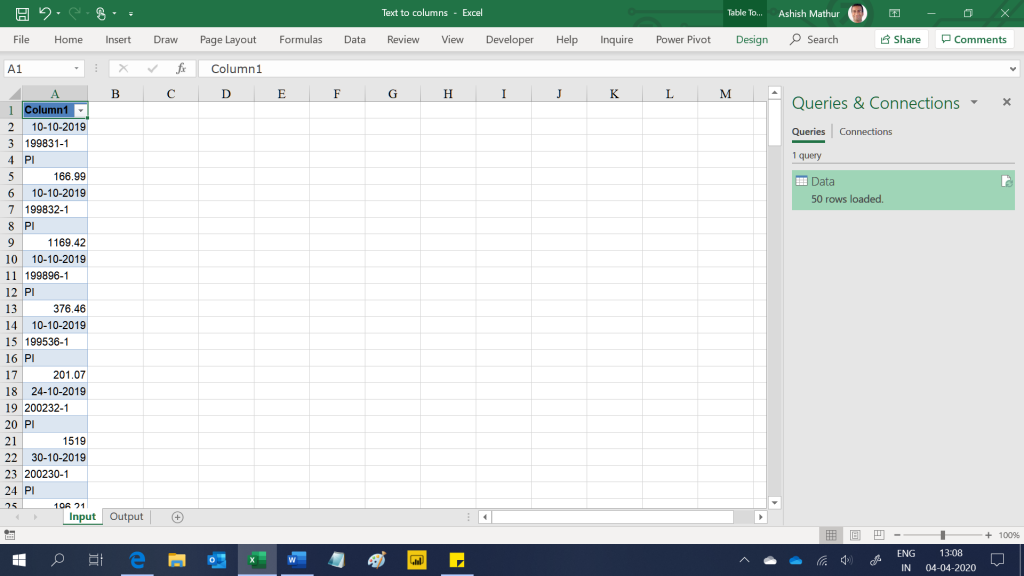
Here is a sample dataset downloaded from an external application. As you can observe, there are anomalies in the dataset:

- All the data appears in a single column when Infact it should be segregated into different columns; and
- There is no separating one record from another. All we know is that each record ends with a number. So:
- Record1 starts at row 2 and ends at row 5
- Record2 starts at row 6 and ends at row 9
- Record3 starts at 14 and ends at row 17
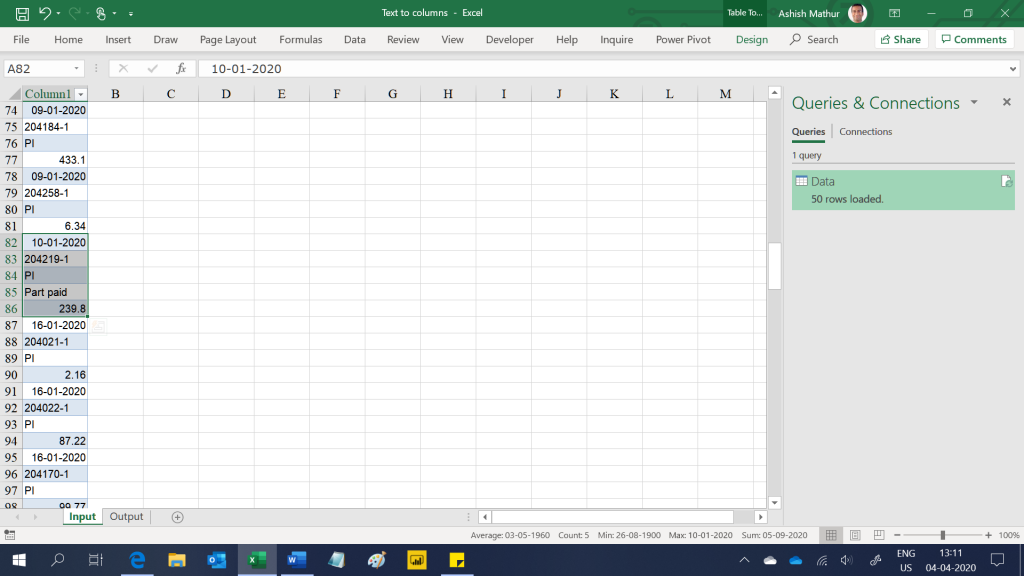
- Not all records have 4 rows. As an exception, the highlighted range below has 5 rows (row 82 to 86). The text entry “Part paid” appears in row 85. In no other record is there the payment status before the number.

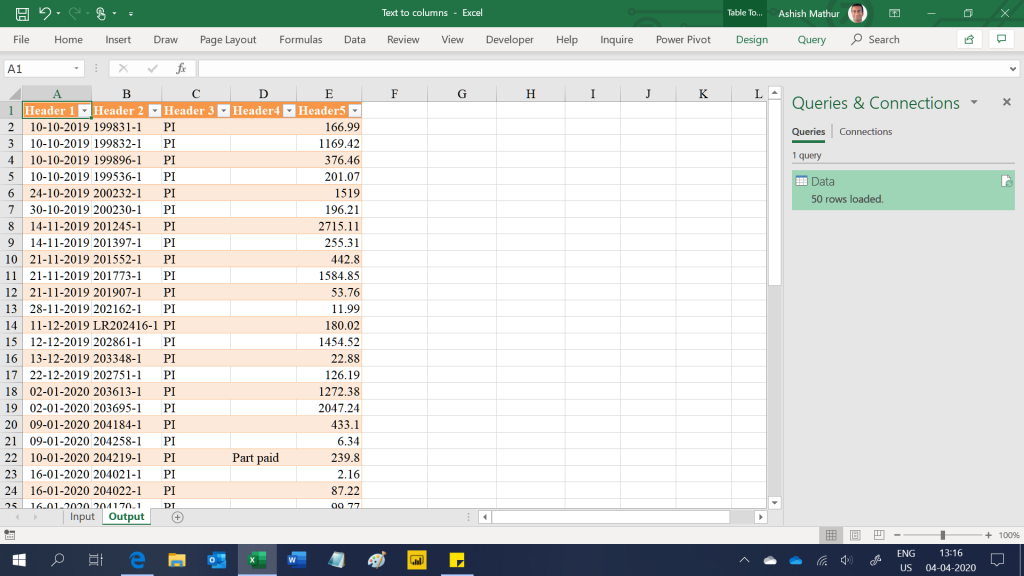
The objective is to clean the dataset and transform it into a 5 column one as shown below:
I have solved this question using the Query Editor (available in both MS Excel and PowerBI Desktop). You may download my solution workbook from here.

Segregating data appearing in a single column into multiple columns where there is blank row between records
{ 0 Comments }