Here’s a simple 4 column dataset
| Bacterin Donor# | Recovery Agency | Date Donor Received | DONOR STATUS |
| B050001 | 1 | 09-06-2005 00:00 | ACCEPT |
| B050002 | 3 | 09-06-2005 00:00 | ACCEPT |
| B050003 | 1 | 09-06-2005 00:00 | ACCEPT |
| B050004 | 1 | 09-06-2005 00:00 | ACCEPT |
| B050005 | 1 | 09-06-2005 00:00 | ACCEPT |
| B050006 | 1 | 09-06-2005 00:00 | ACCEPT |
| B050007 | 1 | 09-06-2005 00:00 | ACCEPT |
| B050008 | 4 | 09-06-2005 00:00 | ACCEPT |
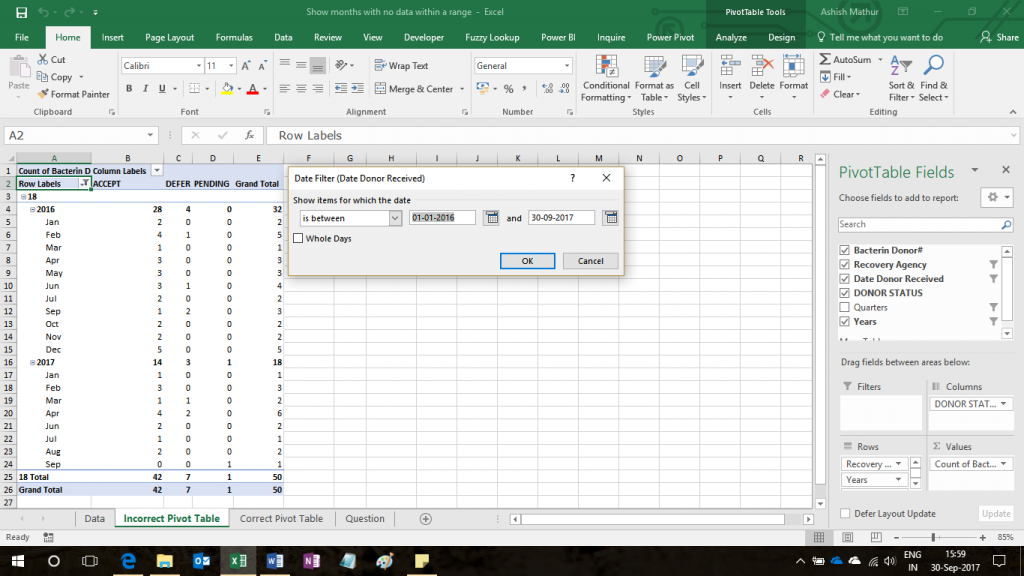
The objective is to determine “The number of Bacterin Donor #’s which fall within January 1, 2016 and September 30, 2017 for Agency number 18 split by Donor Status”. To answer this question. one can build a Pivot Table by dragging Recovery agency and Date to the Row labels, Donor Status to the column labels and Bacteria Donor # to the value area section. One can then group the dates by years and months and apply a criteria of 18 on the Recovery agency. One can then apply a Between filter on dates.
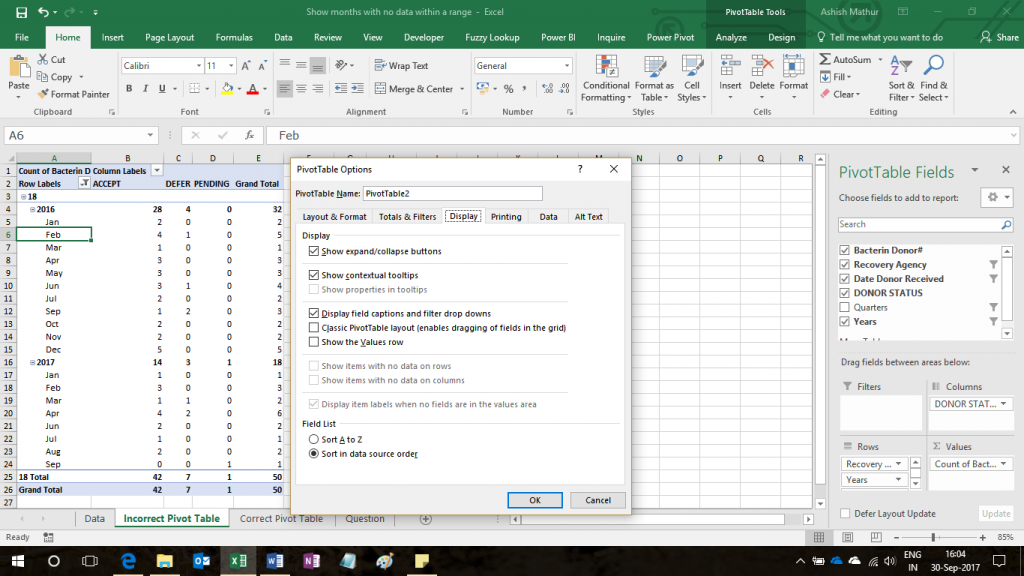
As you can see in the image above August 2016 and May 2017 are missing because there is no data for that period. However one would like to show those 2 months as well. To do so, one can go to Pivot Table Options > Display and click on “Show items with no data on rows”. However, as you can see below, that box is greyed out.
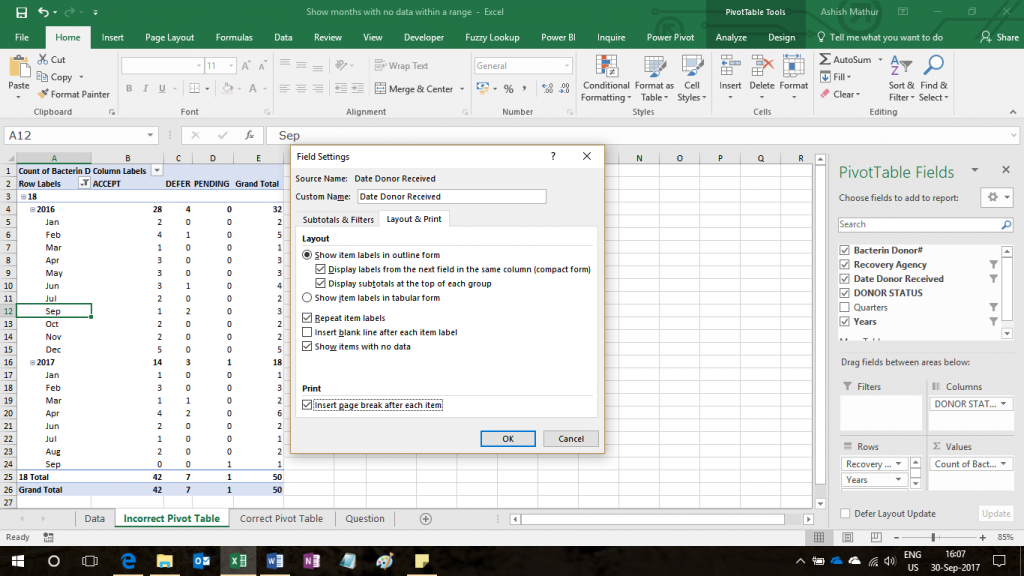
The only other option left is to go to Field Settings > Layout & Print and check the box for “Show items with no data”
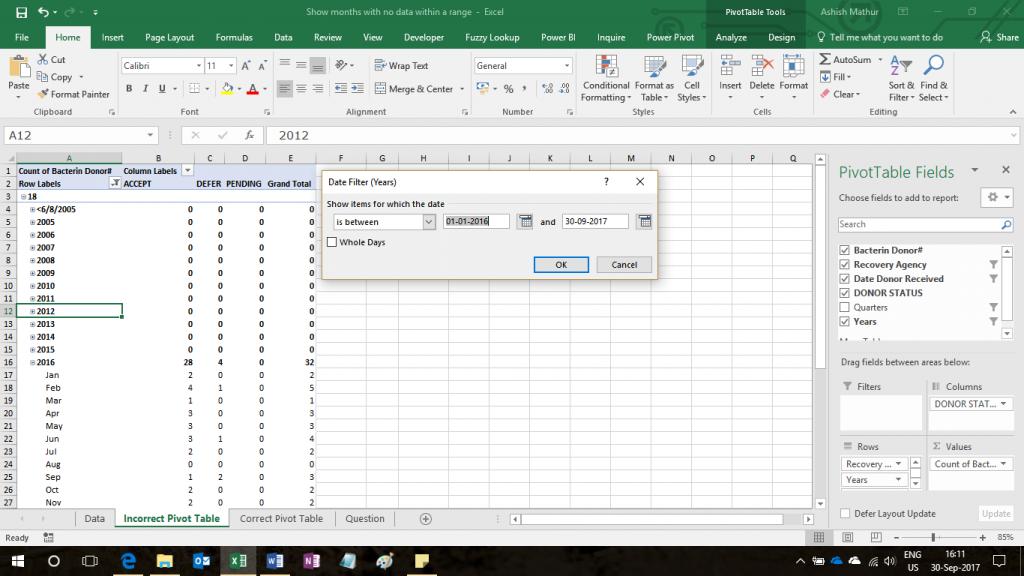
On doing so, the problem is that all dates across all months and years show in the Pivot Table despite the Between Date filter staying intact:
So the question is, how can one show even those months (within a chosen date range) in which there is no data. In other words, one has to think of a way to activate the check box of “Show items with no data on rows” available under Pivot Table Options > Display.
I have solved this problem with the help of the PowerPivot. You may download my solution workbook from here.

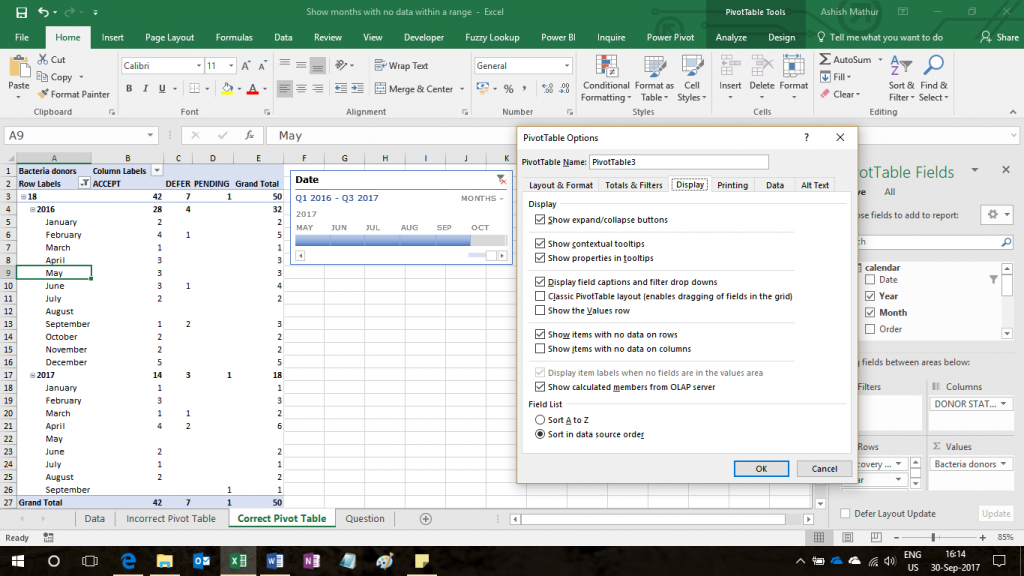
Show months with no data which fall within a certain date range of a Pivot Table
{ 4 Comments }