Here is a simple four column dataset
| Week | Team | User | Codes |
| 1009-1016 | Default-LossMit FAST | INTL\KOrdillano | ATPD/5 |
| 1009-1016 | Default-LossMit FAST | INTL\KOrdillano | ATWI/116 |
| 1009-1016 | Default-LossMit FAST | INTL\KOrdillano | ATWI/3B |
| 1009-1016 | Default-LossMit FAST | INTL\ADulnuan | ATWI/116 |
| 1009-1016 | Direct – HSD | INTL\JCustodioii | S/2 |
| 1009-1016 | Default-LossMit FAST | INTL\abacud | ATWI/116 |
| 1009-1016 | Default-LossMit FAST | INTL\SCaparon | ATWI/116 |
| 1009-1016 | Default-LossMit FAST | INTL\ADulnuan | ATWI/116 |
| 1009-1016 | Default-LossMit FAST | INTL\ADulnuan | ATWI/116 |
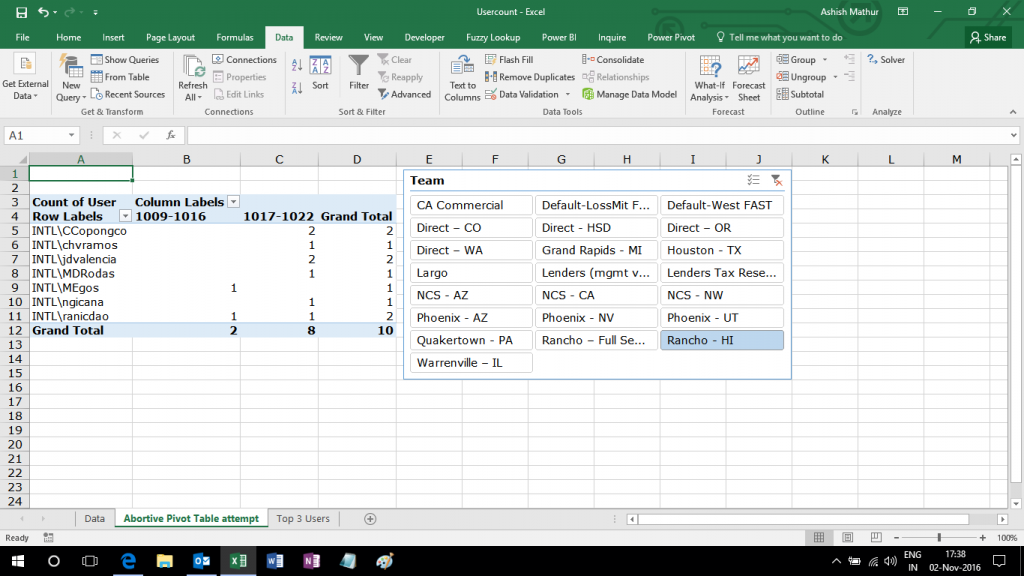
A simple Pivot Table (with a slicer) created from this dataset looks like this
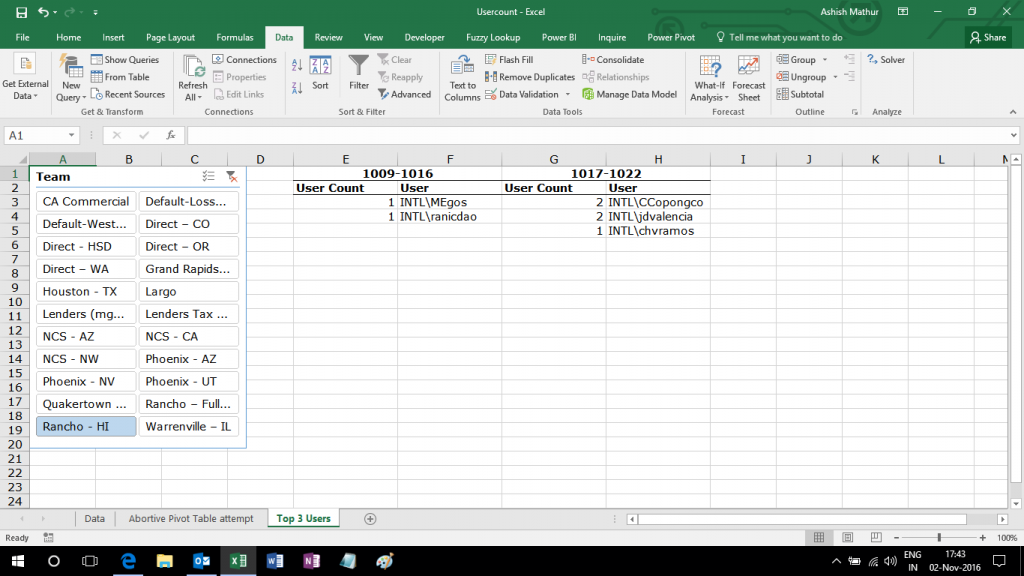
The objective is to determine the Top 3 users of each week for each slicer selection. Unfortunately, there is no way to sort multiple columns of a Pivot Table all at once. Once may either sort by the Grand Total column or by the individual week wise columns. Since we do not want to sort by the Grand Total column, the only way out is to sort the individual week wise columns. The expected result should look like this:
I have solved this problem by using CUBE formulas. You may refer to my solution in this workbook.


Sort individual columns of a Pivot Table based on a slicer selection
{ 0 Comments }