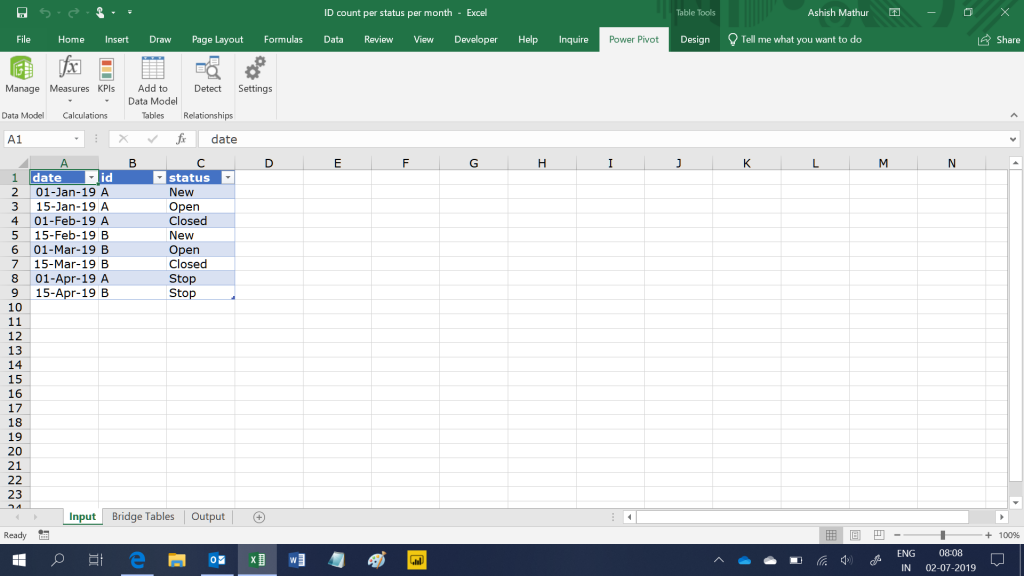
Here’s a simple 3 column dataset showing Date, ID and Status – the status of each ID by Date.
So, the narrative for ID A is:
- It was “New” on Jan 1
- It remained “New” until Jan 14
- On Jan 15, the status changed to “Open”
- It remained “Open” till Jan 31 and the status changed to “Closed” on Feb 1
- It remained “Closed” till March 31 and the status changed to “Stop” on April 1
- It has remained in ‘Stop” status till Today
Note that for the month of March, there is no record for ID A but the status of it has to be treated as Closed (refer point 5 above).
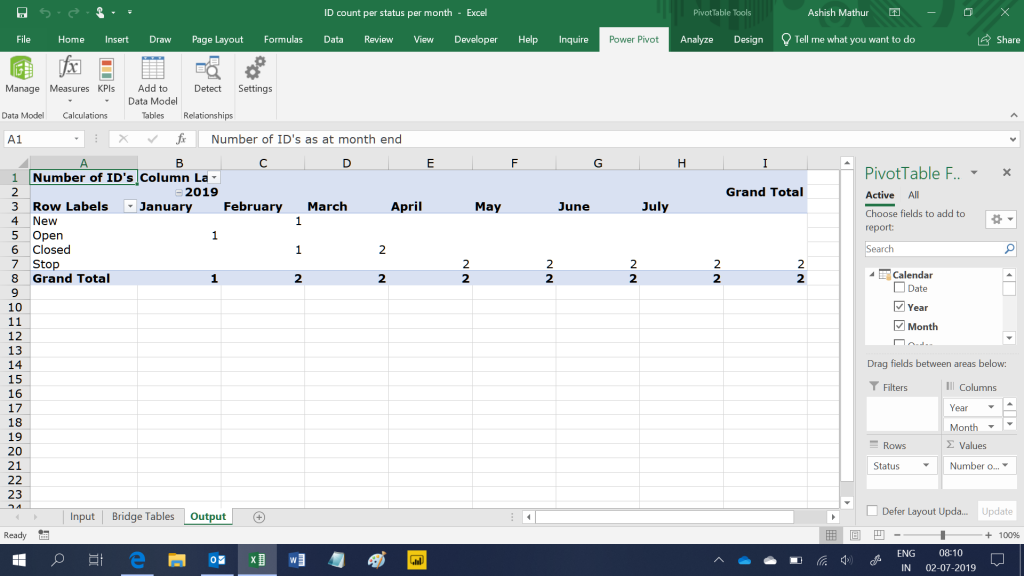
The objective is to count the number of ID’s by status and month. The expected result is:
Please note that the trick part here is to get the result as 2 in cell D6 (Status closed for March). I have solved this problem using Power Query and PowerPivot. Since these two Business Intelligence (BI) tools are available in PowerBI desktop (PBI) as well, you may download a folder with both files (the MS Excel workbook and PBI file) from here.


Summarise data by most recent status
{ 0 Comments }